
Cricket's Second Game: When Every Ball Became a Data Point
सारांश: यह रिपोर्ट क्रिकेट में डेटा-एनालिटिक्स की बढ़ती भूमिका पर एक एवरग्रीन विश्लेषण है, किसी विशेष मैच या सीरीज़ की खबर नहीं। मुख्य बिंदु: 1. मूल्यांकन का आधार परिणाम से प्रक्रिया की ओर खिसका है — 'इंड्यूस्ड शॉट' और ज़ोन-वाइज़ आँकड़े अब स्कोरकार्ड से ज़्यादा मायने रखते हैं। 2. चयन अब औसत के बजाय भूमिका (रोल) पर आधारित है; ऑलराउंडर की परिभाषा बदल चुकी है। 3. T20 ने जोखिम के गणित को बदला — विकेट बचाना हमेशा समझदारी नहीं। 4. तकनीक के तीन स्तर: डीआरएस/बॉल-ट्रैकिंग, खिलाड़ी निगरानी (GPS, लोड), और स्काउटिंग डेटाबेस। 5. सीमाएँ: छोटा सैंपल, मापन-पूर्वाग्रह, ऐतिहासिक पूर्वाग्रह का पुनरुत्पादन, और डेटा स्वामित्व/नैतिकता के अस्पष्ट नियम। 6. संतुलन: डेटा सबूत है, कहानी का मालिक नहीं। सत्यापन-नोट: इस रिपोर्ट में कोई तारीख़, स्कोर, आँकड़ा या खिलाड़ी-कोट शामिल नहीं है, क्योंकि स्रोत सामग्री उपलब्ध नहीं थी। किसी विशेष घटना पर आधारित खबर के लिए मूल टेक्स्ट या सोर्स-युक्त इन्फ़ॉर्मेशन-पॉइंट्स आवश्यक हैं।
In the past decade, the grammar of cricket reporting has quietly changed. A match report once revolved around scores, hundreds and wicket counts. Today the same report carries words like impact, matchup, zone-wise strike rate, economy breakdown and workload index. This is not merely a fashion for jargon. It signals that a second game is being played off the field — a game of calculation — and that game increasingly decides who plays, who bowls when, and which shot is attempted against which ball.
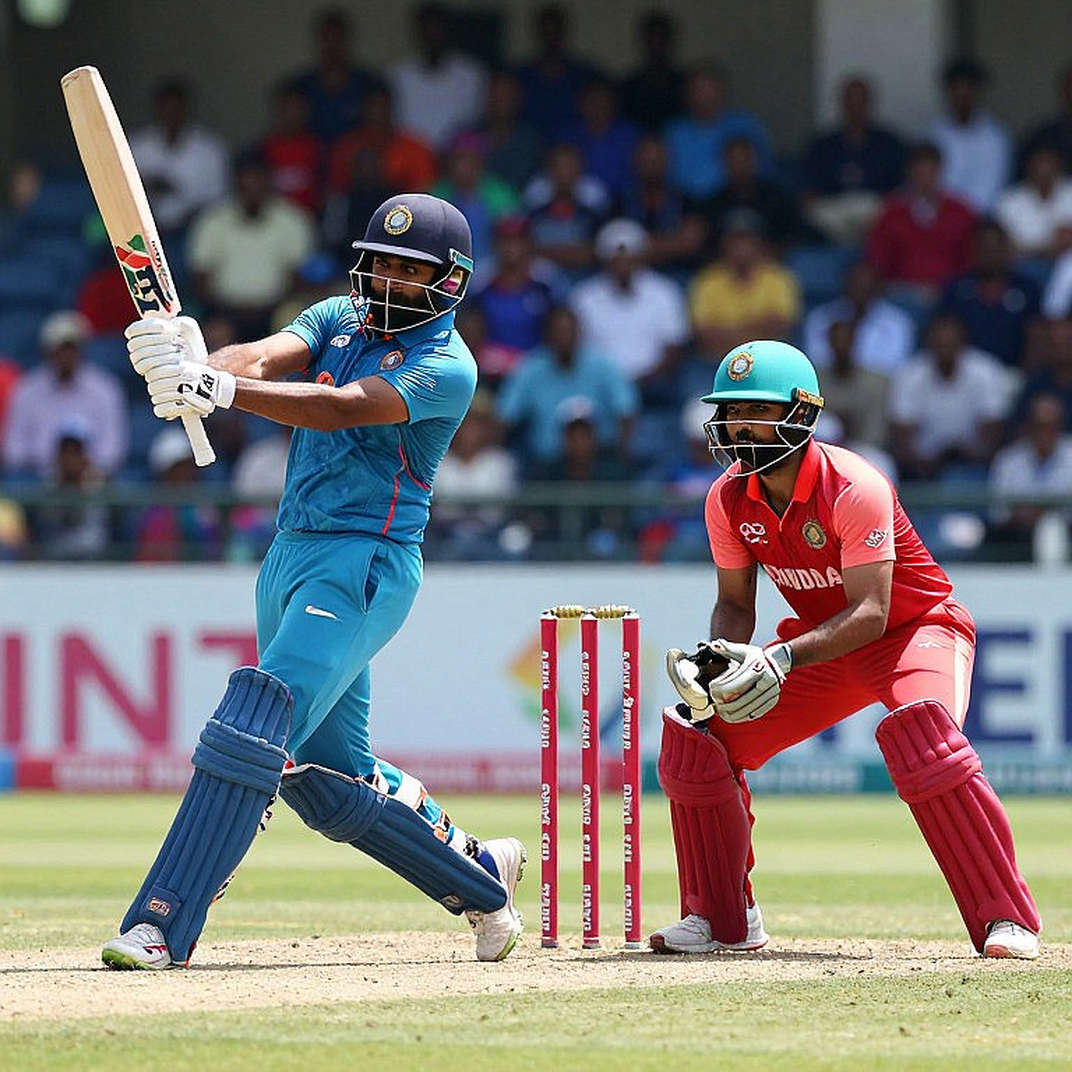
To understand the shift, it helps to accept that cricket is one of the few sports where turning every event into a number feels natural. Baseball has a century-old tradition of this; cricket arrived late but changed the language of the game almost immediately. A ball's line, length and speed, a batter's footwork, the angle of a shot, the position of a fielder — all of it can be captured by cameras and sensors, and once captured, it can be questioned.
One ball, many metrics
Modern analytics' biggest achievement is that it dismantled the old, impressionistic distinction between a good ball and a bad ball. Commentators once said a bowler bowled a fine line without reward. Now the question is: what is the batter's strike rate on that line? How many runs did he score there? How often did he take risk, and how often did he escape? The process is being measured instead of merely the outcome.
This is why bowling reviews today talk more about induced shots than about edges and misses. A bowler's value is judged by how many weak shots he forced, whether or not those shots became catches. A bowler can see three catches dropped in one match and look poor in the scorecard, yet ten matches of data will show that the same bowler is consistently creating the most mistakes. That gap is the distance between old scorecard journalism and new analytical journalism.
Selection logic has changed
The clearest impact is on team selection. Selectors once relied on first-class averages, recent form and the eye test. Now a player is assessed for the situation he fits: will he be useful against spin in the powerplay, can he bowl yorkers at the death, does his fielding save runs in the ring?
The direct consequence is that the definition of an all-rounder has shifted. An all-rounder once meant someone who contributed a little with both bat and ball. Now teams look for a specialist in one role who also offers measurable value in the other. That is why several sides now carry three or four players who had no clear slot in the old vocabulary.
The second consequence is role-based selection. A batter may have a fine overall average, but if he bats slowly at number six or seven, that average is of little use to the team. Conversely, a lower-average batter who can take risk on every ball makes the eleven. This change unsettles older fans, because they grew up treating averages as proof of quality.

T20 and the mathematics of risk
T20 accelerated the whole process. In twenty overs every ball is so valuable that saving wickets is not always the smart play. Analytics showed that a team's scoring often dips after the first wicket falls, so deferring risk can be expensive. As a result, batters now attack from the first ball, and teams prefer impact over floaters.
The same mathematics reshaped bowling plans. Slower balls, wide yorkers and bouncers at the death are no longer arbitrary choices but decisions based on a batter's shot zones. If a batter likes the leg side, he is kept on a wide line; if he struggles through cover, a gap is created there. Field settings are less about a captain's experience and more about a pre-built plan.
A curious paradox emerges here. When every team has roughly the same data, data stops being a source of advantage. Advantage returns to the oldest things: creativity, unpredictability, and the decision taken in a moment that no model anticipated. Several coaches argue for this reason that analytics has made the game more predictable — and that unexpected risk-taking has therefore become more valuable than before.
Beyond DRS: the deeper layers
The most visible face of technology is DRS, but the real work happens behind the scenes. Ball tracking, Hawk-Eye, UltraEdge and Snickometer changed how umpiring decisions are checked. This did not end disputes; it relocated them. Once the argument was with the umpire; now it is with the limits of the technology. The umpire's call provision is a product of that tension: while technology is not fully decisive, a protected zone is left for human judgement.
The second layer is player monitoring — GPS trackers, heart-rate monitors, sleep and load data. This is no longer a hobby of a few teams but standard practice for major boards. The question is who owns that data: the board, the franchise or the player? The answer differs everywhere, and that is the seed of future disputes.
Fast bowlers' burden and workload
Fast-bowling injuries are a constant theme. Part of the cause is the calendar — three formats, leagues, tours and practice games. Workload management has become the answer, resting a player from some matches so he is fresh for a major tournament.
The policy draws criticism. A spectator who buys a ticket does not want to learn that his favourite player is resting under load management. For the board it is an economic question, for the player a career question, for the fan an emotional one. Analytics did not resolve this tension; it merely rendered it in numbers and made it more visible.
Interestingly, there is no universal workload standard. Each board sets its own threshold, and that threshold is often shaped more by commercial need than by medical advice. This is where data can serve transparency and can equally serve as an excuse.
Scouting: from video to algorithms
Scouts once travelled to watch foreign matches and filled notebooks. That work now happens through video databases and queries: what is this batter's strike rate against this spinner, how many catches have gone down off this bowler's slower ball. Doors have opened for smaller cricket nations and domestic players, because good performances can now reach someone sitting far away.
But there is a risk. When scouting shifts from who wins the most matches to who fits the model best, some players can be overlooked despite their strengths. Players whose game is unconventional — an odd bowling action, unusual shot selection — become outliers in the model, even though those same outliers can turn matches on the field.
Domestic cricket and inequality
Analytics has not been shared equally. Boards with money, cameras and analysts pull ahead in depth of data; those without remain dependent on the eye test. The inequality exists not only between nations but within them — between academies in big cities and grounds in small towns.
There is a counter-hope. Cheap cameras, mobile apps and open material have made video analysis possible at lower levels. A district coach can now analyse his bowler's slower ball frame by frame, something that was once available only at elite centres. Technology has both widened and narrowed the gap.
Broadcast and the viewer
Graphics are now part of the sport. Wagon wheels, pitch maps, matchups and predictions appear before the commentary does. The benefit is that viewers understand nuance; the cost is that simple storytelling becomes harder. When numbers scroll constantly, it is easy to forget that a human being is standing out there — tired, sore-kneed, short of sleep.
Good sports journalism therefore does both: it uses data as evidence without letting data become the boss. A statistic tells you what happened; it does not tell you why. The why is usually found in a player's interview, a coach's decision, or the unspoken pressure that never enters the scorecard.
The blind side of data
Every model learns from the data it is given. Where data on a situation is thin — an unusually behaved pitch, a new bowling style — the model is either silent or falsely confident. Cricket is full of such situations, because every ground, every season and every ball differs.
The second blind side is measurement itself. What can be measured gets treated as what matters; what cannot — captaincy under pressure, dressing-room mood, a young player's confidence — gets ignored. This is the streetlight effect: the key is searched for where the light is.
The third dimension is bias. If historical data gave fewer opportunities to players of a certain background, region or style, the model will rate them as less successful — and the bias reproduces itself. Analytics aspires to neutrality, but it is built from the data of a world that was not neutral.
Ethics and ownership
When a player's heart rate, sleep and injury history become data, the question of ownership arises. Can a franchise sell that data? Can selectors view it? Can a player demand its deletion? Most cricket boards do not yet have clear answers.
The same question applies to broadcast rights. Who owns match data — the board, the broadcaster, or the public? In several countries there are demands that basic statistics remain open so independent researchers and journalists can analyse them. Where that has not happened, information has concentrated in a few hands.
The coach, the captain and the analyst
A new power centre has emerged inside teams: the performance analyst. In some sides his opinion carries as much weight in selection as the coach's. Decisions become more rational, but accountability blurs. When a call fails, it is unclear whether the mistake belonged to the captain, the coach, or the spreadsheet that suggested it.
The most effective teams appear to be those where the analyst offers, the captain connects that to on-field reality, and the coach balances the two. Where the analyst is treated as an order-giver, teams often stiffen; where he is ignored entirely, opportunities are missed.
What comes next
Three directions look clear. First, the expansion of real-time analysis: adjusting plans mid-match as conditions change. Second, injury prediction and individualised training plans driven by a player's physical data. Third, personalisation of the fan experience, where viewers choose the statistics they want.
One warning is necessary. Cricket's beauty lies in its uncertainty. If prediction becomes so precise that the viewer knows the result in advance, the sport loses its pull. Analytics should aim to explain probabilities, not to announce outcomes.
Conclusion
Cricket is now played on two levels — on the field, and in the data generated off it. Each shapes the other. Teams that understand this double game gain an edge; teams that rely on only one level remain either in the dark or in blind faith. The best position is the one considered ideal in every profession: listen to the numbers, but never let them become bigger than the game. Because in the end, a scorecard can tell you who won; it cannot tell you what that moment felt like.